Odoo’s debug mode is the standard tool developers and administrators use to inspect, test, and configure the system beyond normal user access. It exposes the technical structure of models, views, and configurations directly within the interface, making it possible to analyze and modify system behavior without editing code.
1. Activating Debug Mode
To enable debug mode, simply append ?debug=1 to any Odoo URL.
Example:
https://your-domain.com/web?debug=1
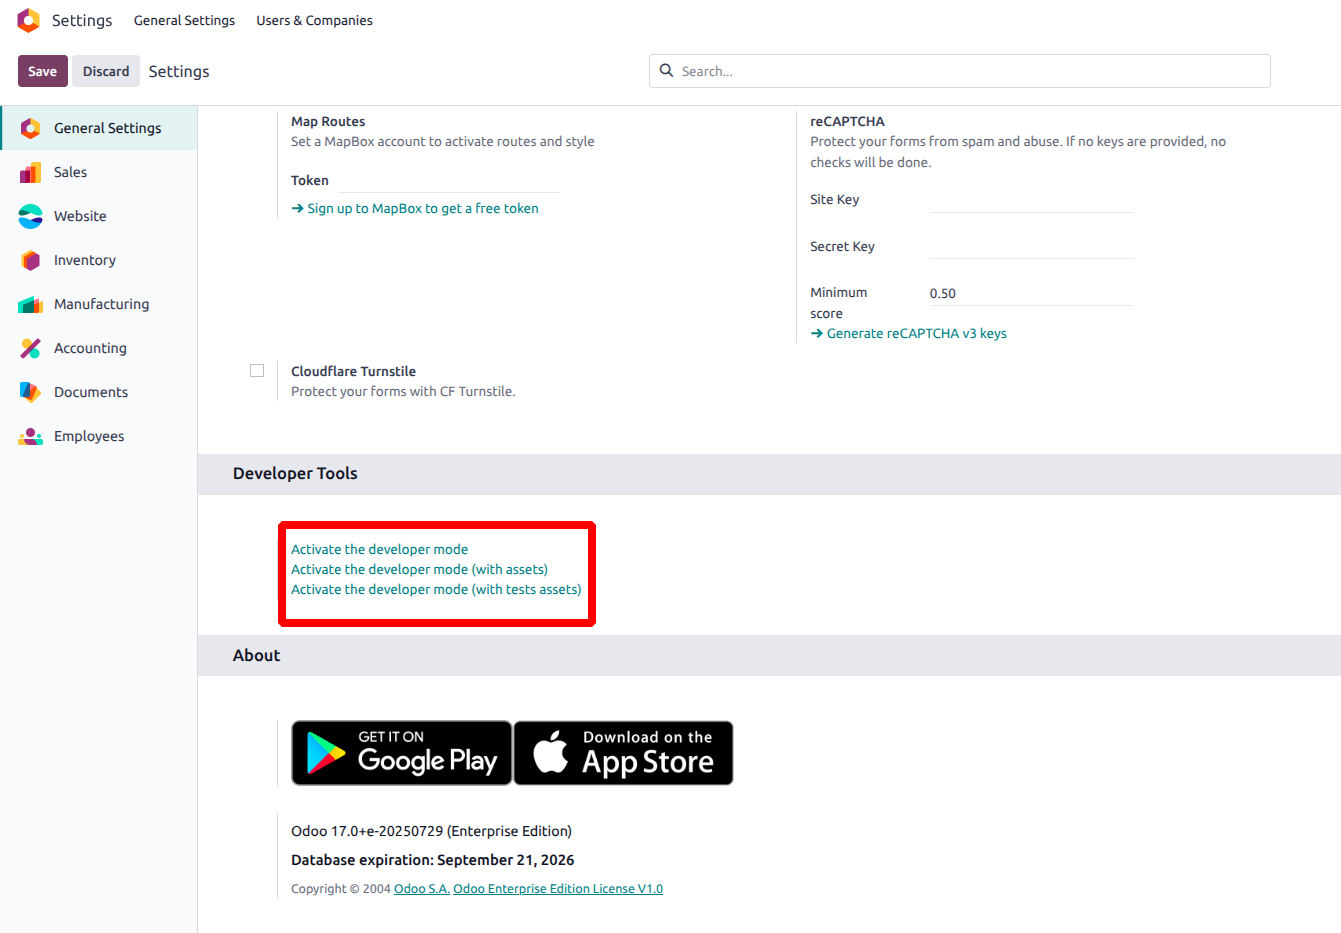
Alternatively, it can be turned on through the Settings → General Settings → Developer Tools → Activate the Developer Mode menu. Once enabled, Odoo reveals a range of technical tools within the user interface.
2. Accessing the Technical Menu
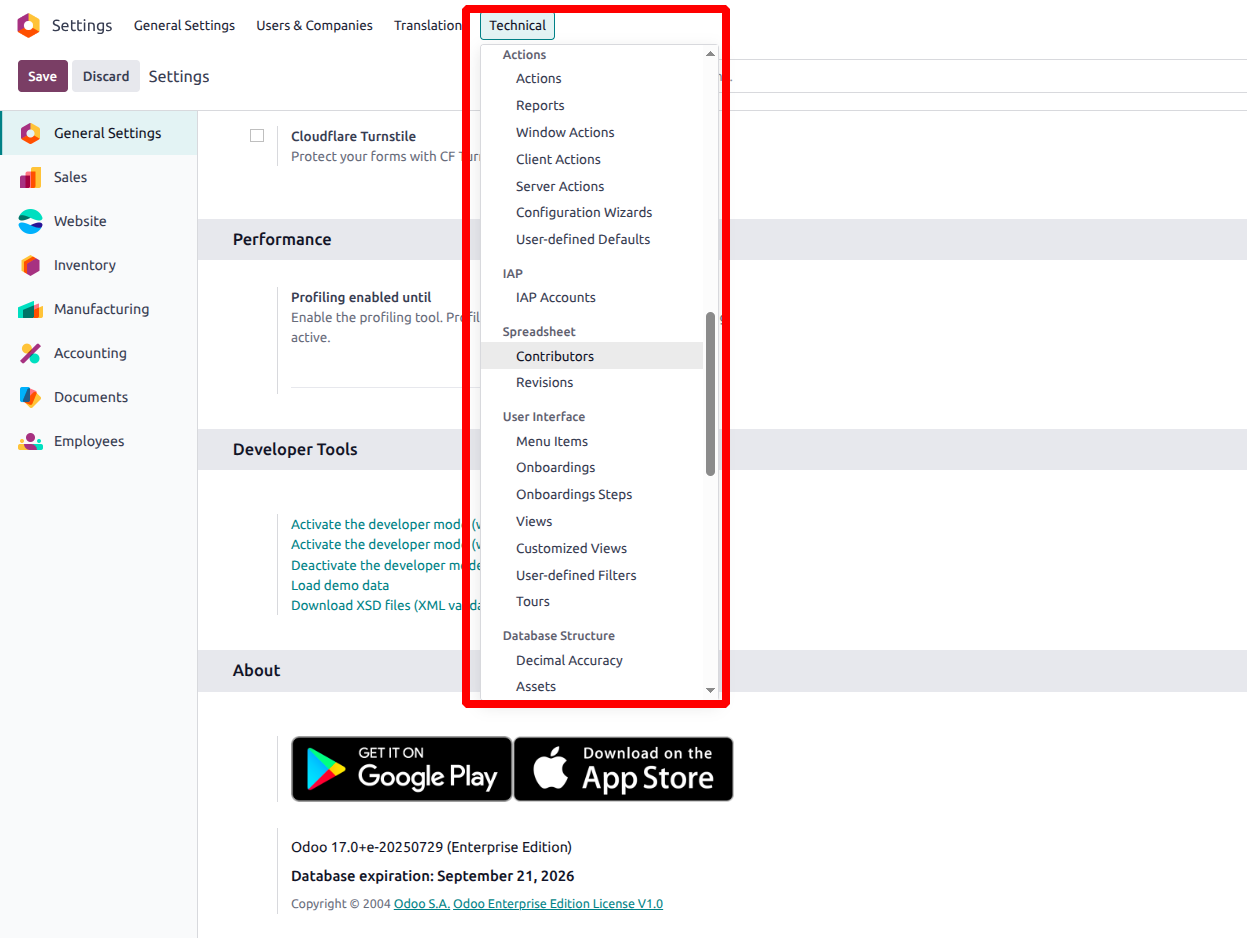
When debug mode is active, a new Technical section appears under Settings. This section provides full access to system internals such as:
- Models – view all database models, fields, relations, and properties.
- Actions and Menus – inspect how menus link to models and views.
- Record Rules and Access Rights – review user permission logic.
- Scheduled Actions (Cron Jobs) – check automated server processes.
- System Parameters – modify configuration variables stored in ir.config_parameter.
3. Editing Views from the Interface
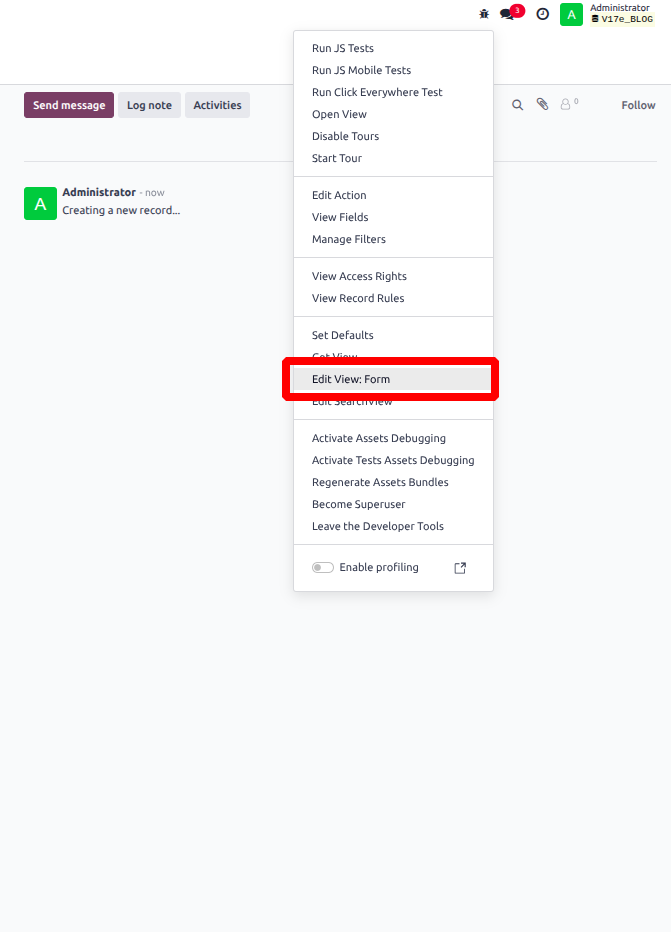
With debug mode activated, Odoo adds the “Edit View” option to all forms, lists, and kanban views. Developers can directly open the XML structure, add fields, or adjust layout components without server access. This capability is commonly used to test changes before applying them in module files.
Example:
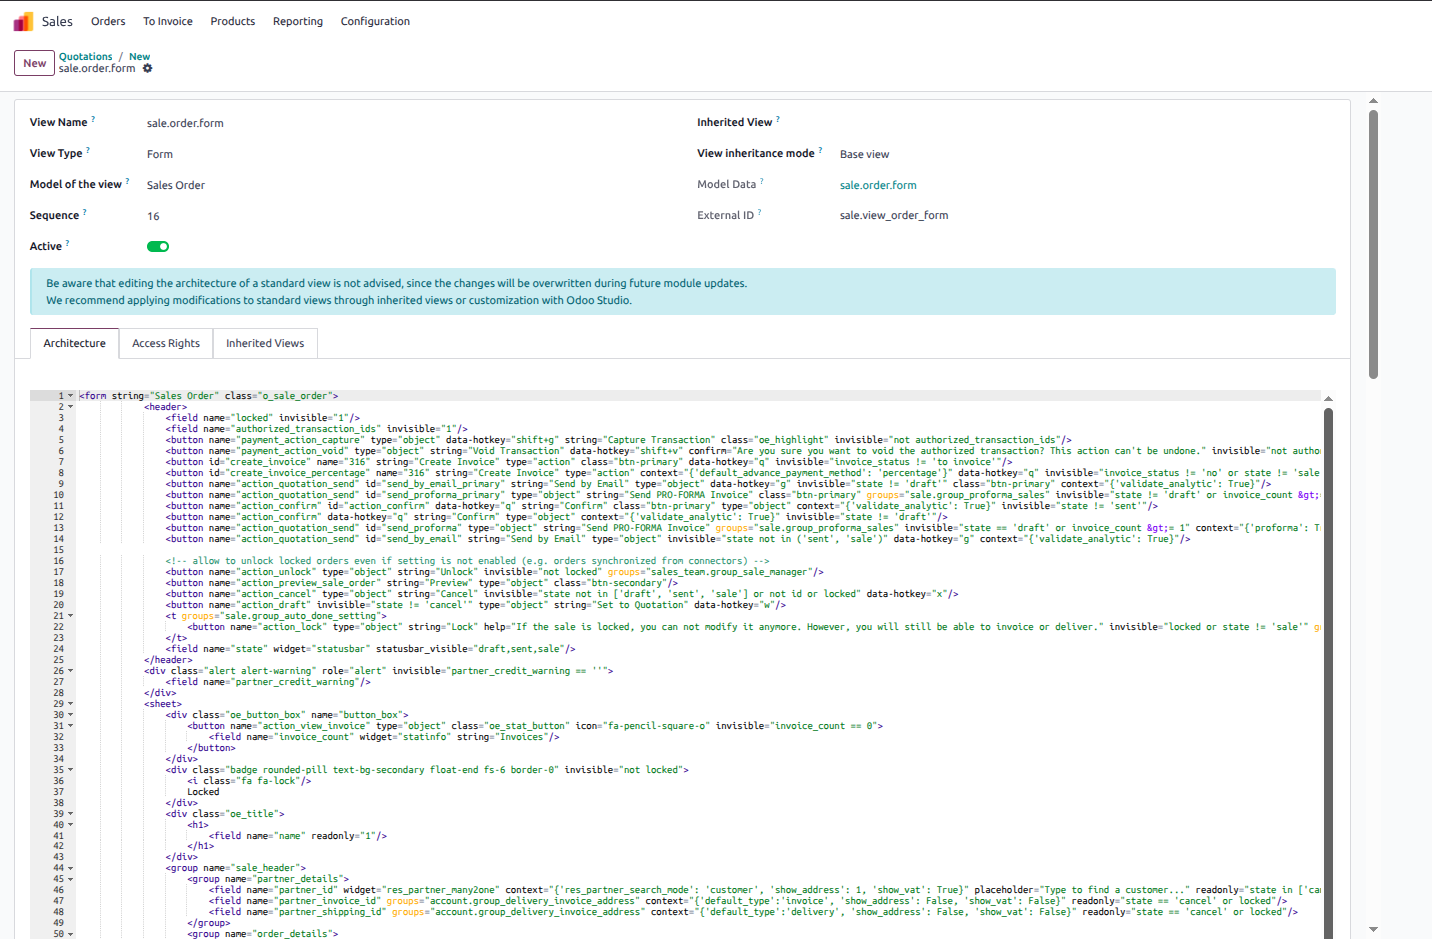
In this section, users can directly modify the XML structure of the view from the interface. However, every change must follow Odoo’s XML parsing rules to avoid validation errors or view conflicts. Proper indentation, tag hierarchy, and field references must remain consistent with Odoo’s expected syntax to ensure the view loads correctly.
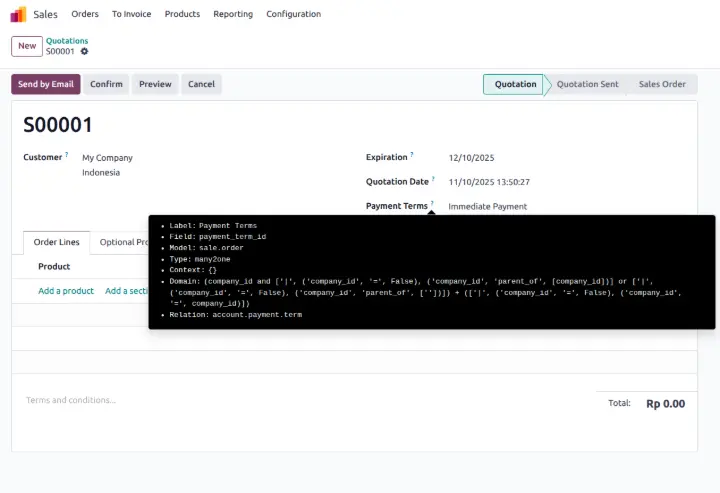
4. Viewing Field Information and Model Structure
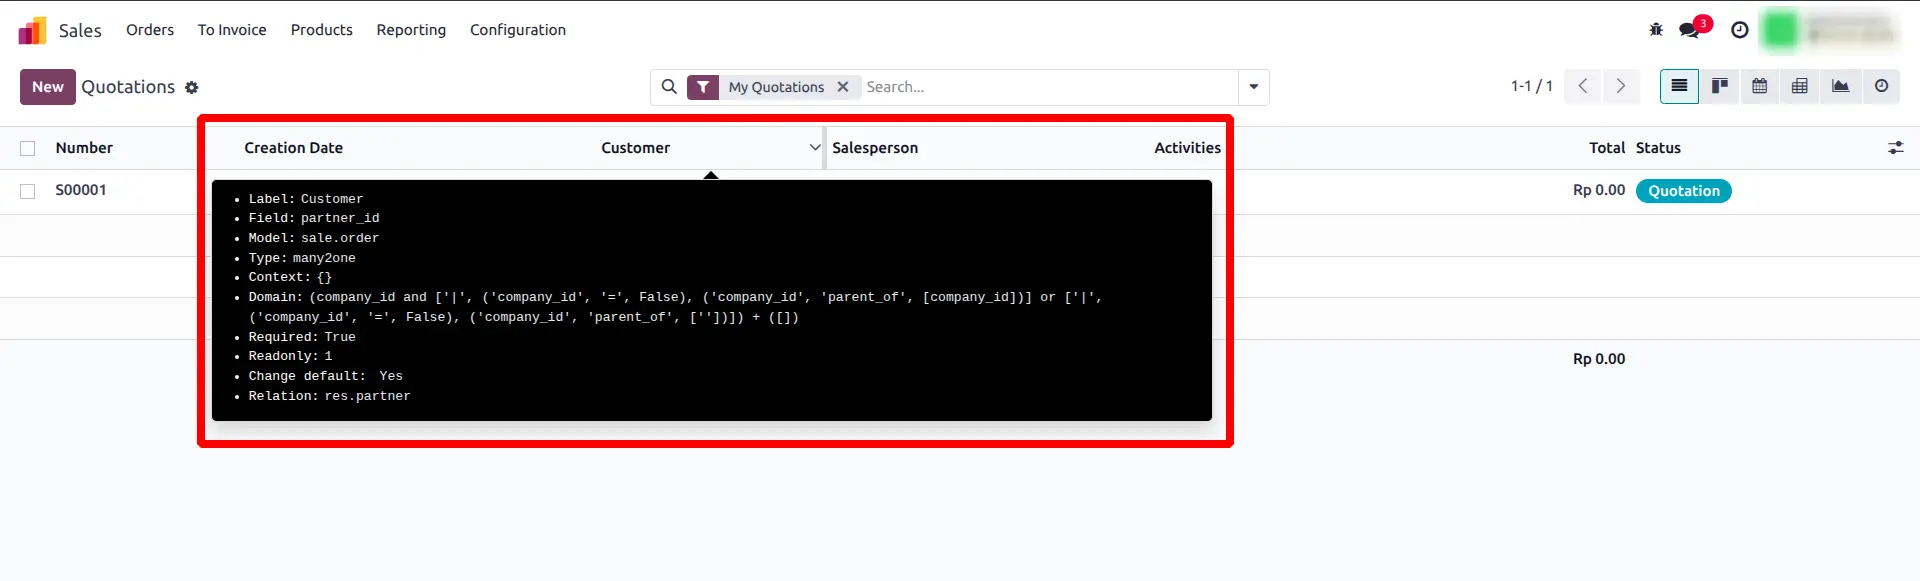
Hovering over a field in a form view displays its technical name, field type, and model source. This feature helps developers identify field references quickly when writing Python code or custom XML views.
Not only in form view Tree views can also be hovered in the same way.
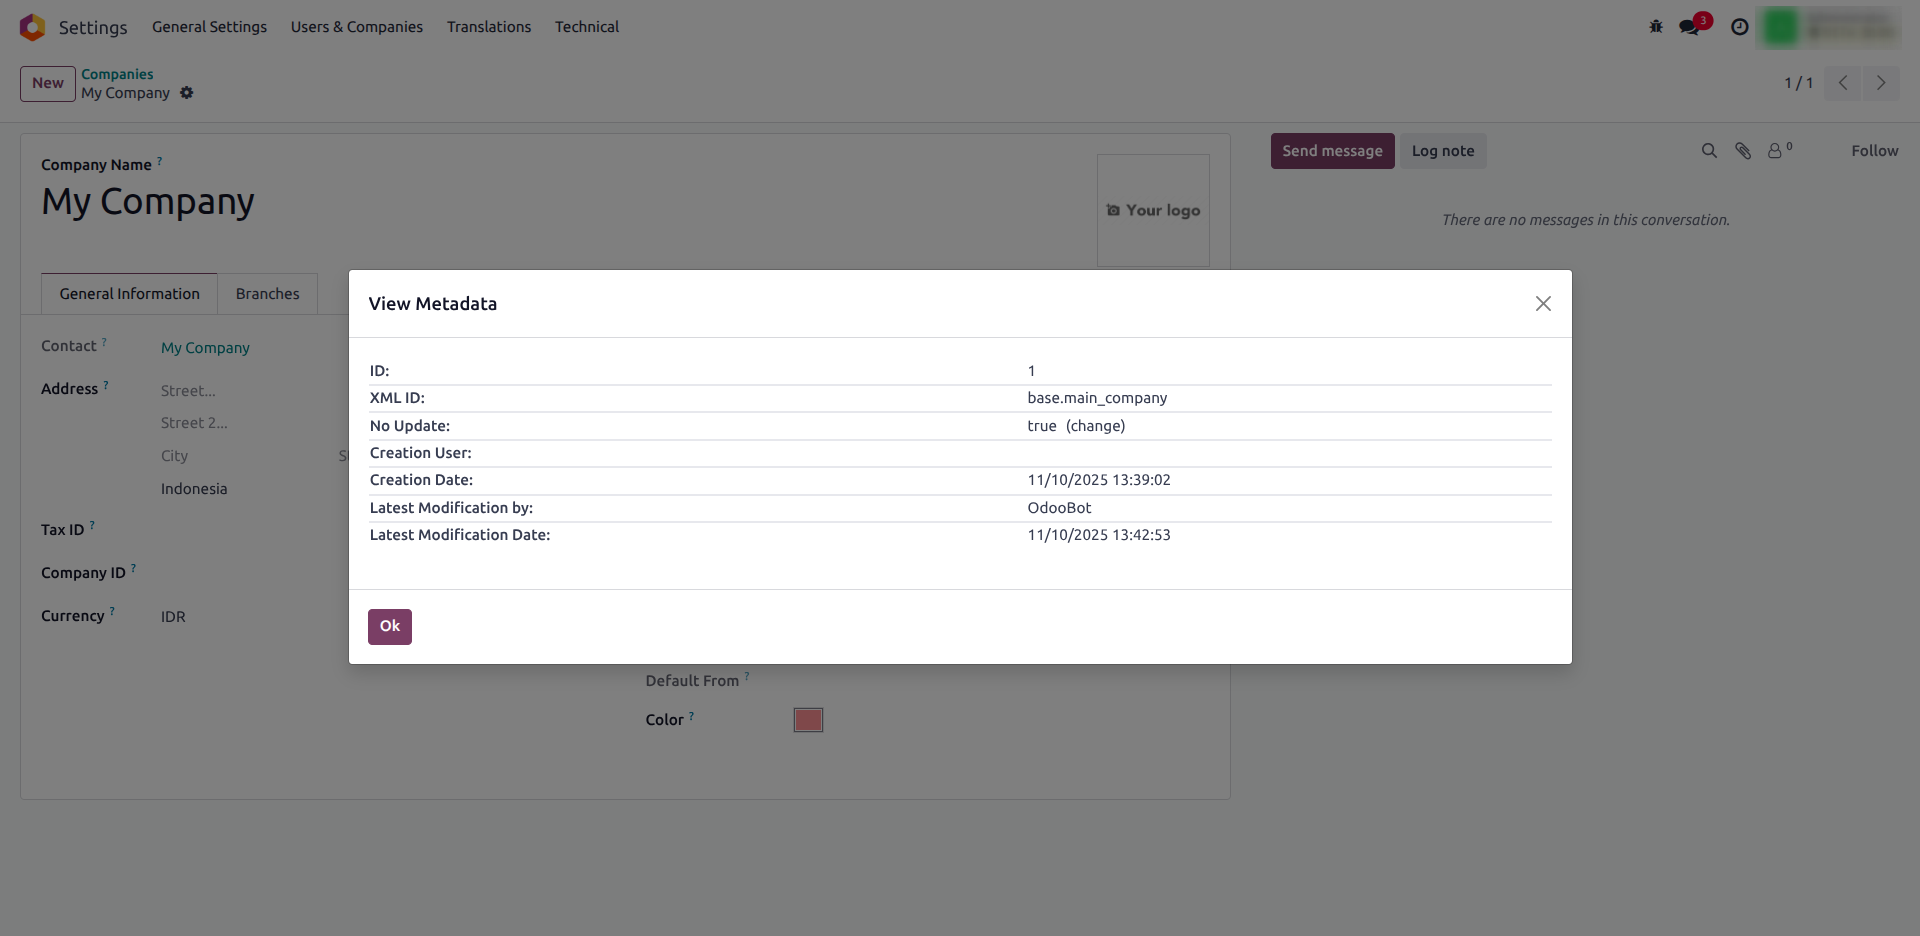
5. Viewing Record Metadata
To access this information, click the small bug icon on the top-right corner of the interface to open the developer tools, then select View Metadata from the available options. This will display detailed information about the selected record.
Each record now includes a “View Metadata” option, which reveals:
- Who created and last updated the record.
- The corresponding external ID (XML ID) if available.
- Timestamps for creation and modification.
You use this to trace data changes and identify when or by whom a record was modified.
Example:
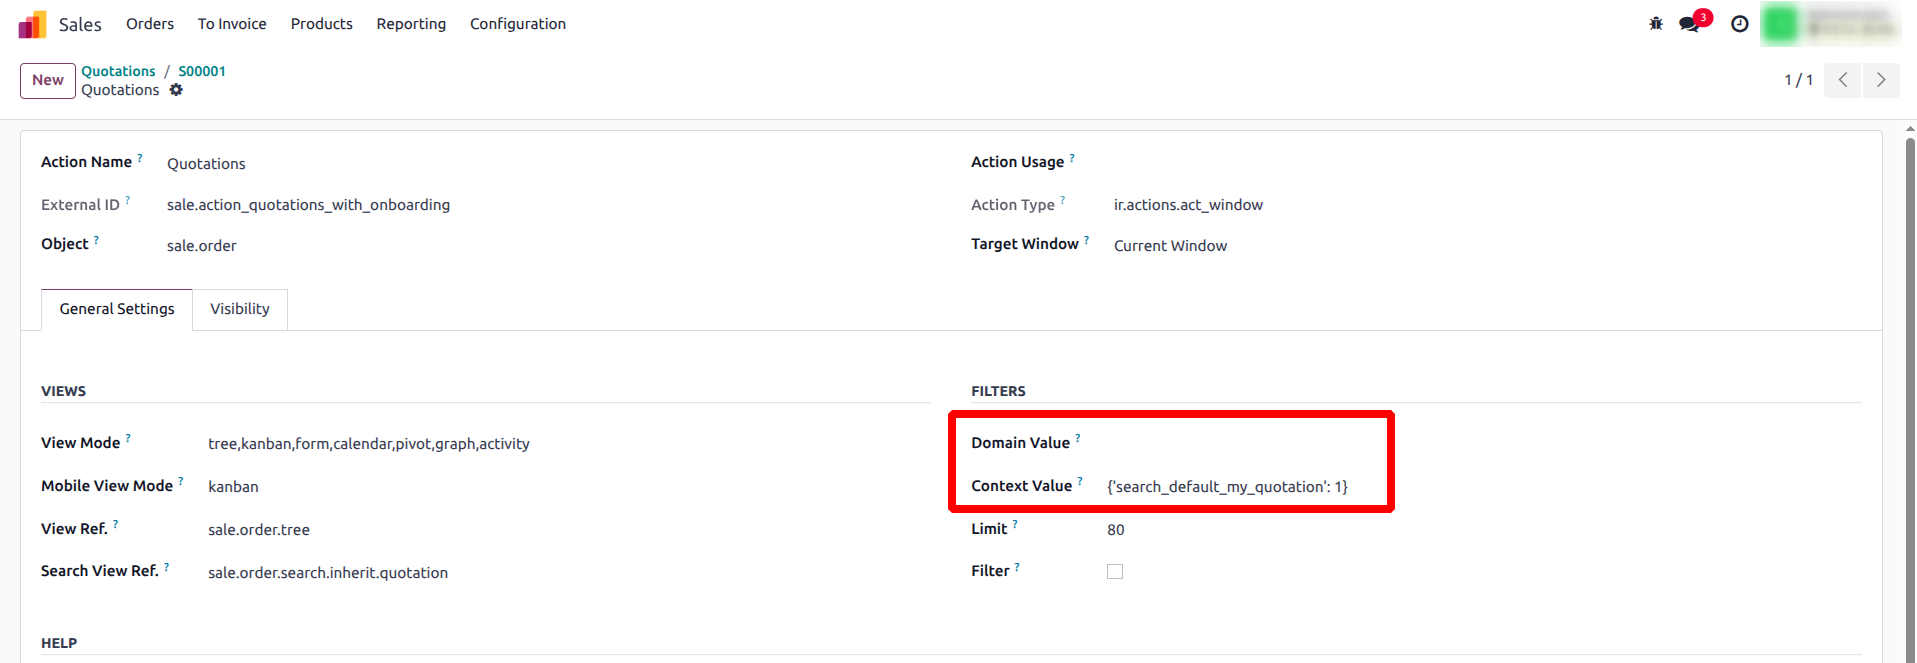
6. Inspecting Context and Domain
To inspect the context and domain, click the bug icon at the top-right corner of the interface to open the developer tools. From the dropdown menu, choose Edit Action. This option will open the action record of that menu it displays the domain and context definitions applied to the current view, allowing you to analyze how data is filtered or dynamically loaded.